If you’d like to get started with data analysis in Python, pandas is one of the first libraries you should learn to work with. From importing data from multiple sources such as CSV files and databases to handling missing data and analyzing it to gain insights – pandas lets, you do all of the above. To start analyzing data with pandas, you should understand the fundamental data structure in pandas: data frames. In this tutorial, you’ll learn the basics of pandas dataframes and common methods to create dataframes. You’ll then learn how to select rows and columns from the dataframe for retrieving subsets of data. For all this and more, let’s get started.
Installing and Importing Pandas
As pandas is a third-party data analysis library, you should first install it. It’s recommended to install external packages in a virtual environment for your project. If you use the Anaconda distribution of Python, you can use conda for package management. You can also install pandas using pip: After installing pandas, you can import it into your working environment. In general, pandas is imported under the alias pd:
What Is a DataFrame in Pandas?
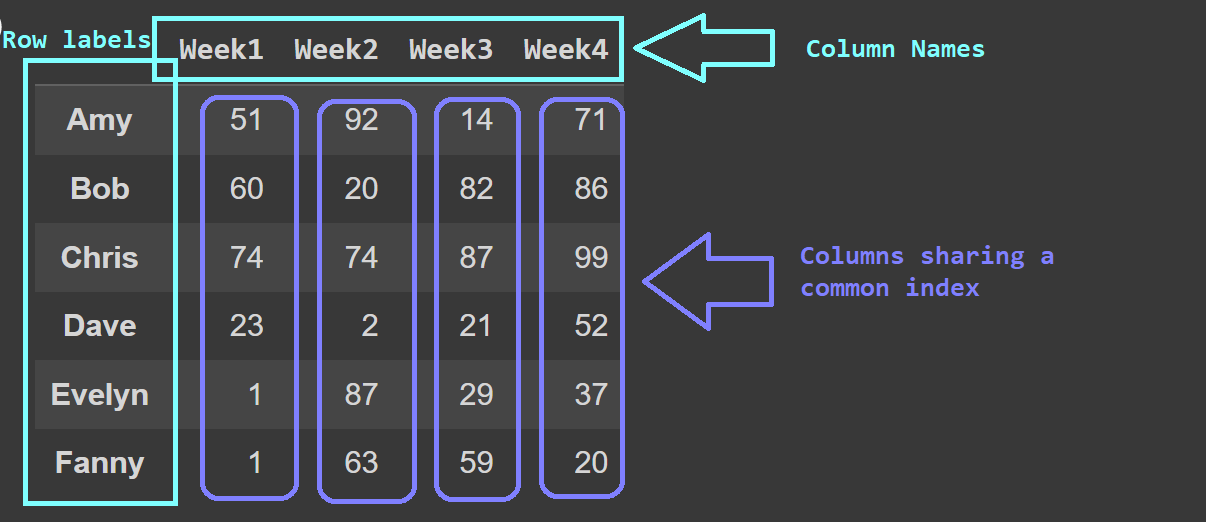
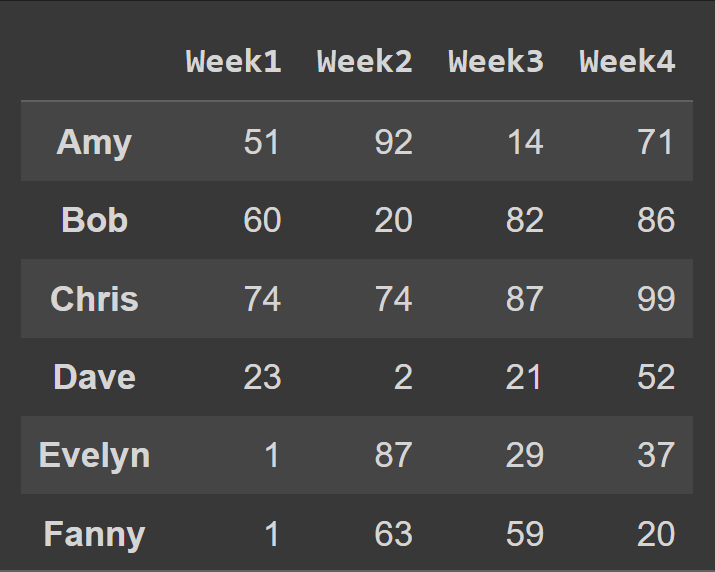
The fundamental data structure in pandas is the data frame. A data frame is a two-dimensional array of data with labeled index and named columns. Each column in the data frame called a pandas series, shares a common index. Here’s an example data frame that we’ll create from scratch over the next few minutes. This data frame contains data on how much six students spend in four weeks. The names of the students are the row labels. And the columns are named ‘Week1’ to ‘Week4’. Notice that all the columns share the same set of row labels, also called the index.
How to Create a Pandas DataFrame
There are several ways to create a pandas data frame. In this tutorial, we will discuss the following methods:
Creating a data frame from NumPy arrays Creating a data frame from a Python dictionary Creating a data frame by reading in CSV files
From NumPy Arrays
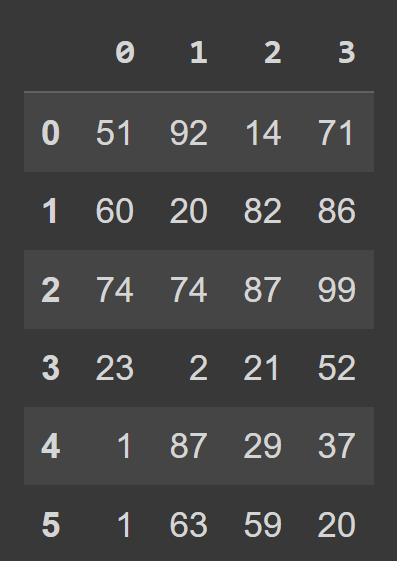
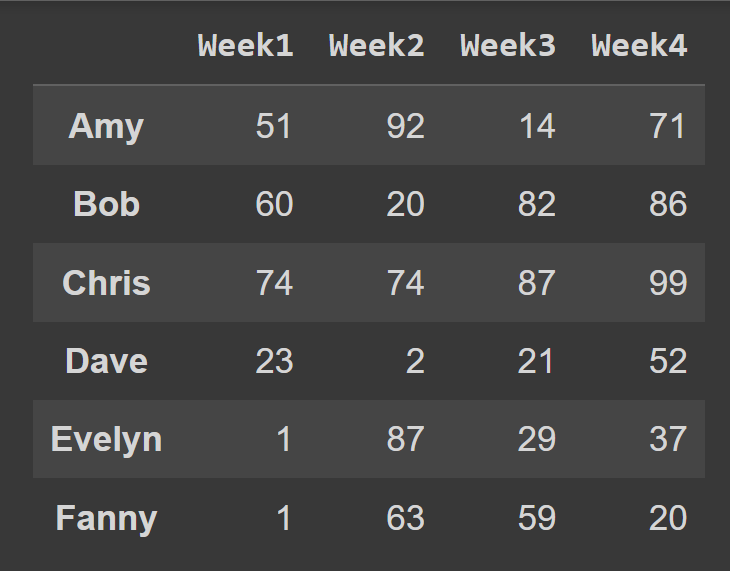
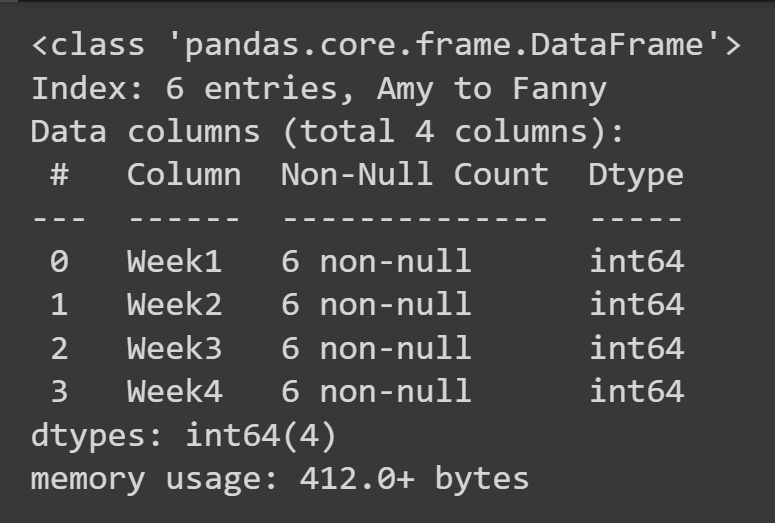
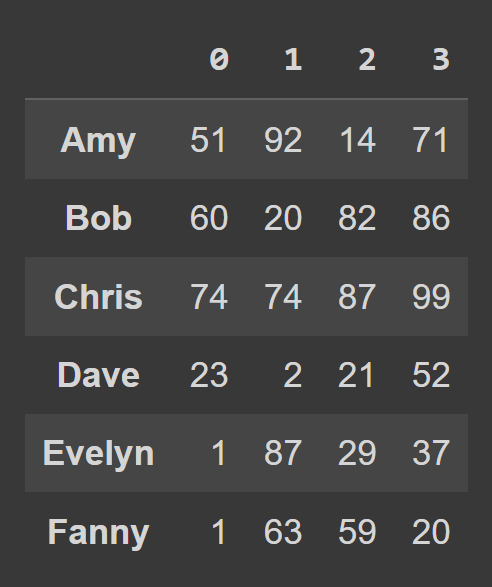
Let us create a data frame from a NumPy array. Let’s create the data array of shape (6,4) assuming that in any given week, each student spends anywhere between $0 and $100. The randint() function from NumPy’s random module returns an array of random integers in a given interval, [low,high). To create a pandas data frame, you can use the DataFrame constructor and pass in the NumPy array as the data argument, as shown: Now we can call the built-in type() function to check the type of students_df. We see that it is a DataFrame object. We see that by default, we have range indexing which goes from 0 to the numRows – 1, and the column labels are 0, 1, 2, …, numCols -1. However, this reduces readability. It will help to add descriptive column names and row labels to the data frame. Let’s create two lists: one to store students’ names and another to store the column labels. When calling the DataFrame constructor, you can set the index and columns to the lists of row labels and column labels to use, respectively. We now have the students_df data frame with descriptive row and column labels. To get some basic information on the data frame, such as missing values and data types, you can call the info() method on the data frame object.
From a Python Dictionary
You can also create a pandas data frame from a Python dictionary. Here, data_dict is the dictionary containing student data:
The names of the students are the keys. Each value is a list of how much each student spends from weeks one through four.
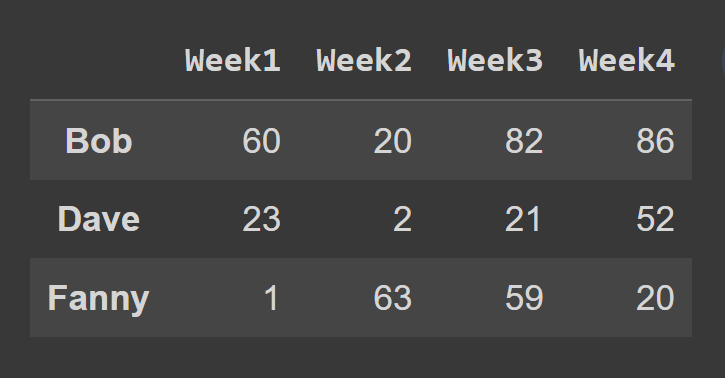
To create a data frame from a Python dictionary, use from_dict, as shown below. The first argument corresponds to dictionary containing the data (data_dict). By default, the keys are used as the column names of the data frame. As we’d like to set the keys as the row labels, set orient= ‘index’. To change the column names to the week number, we set columns to the cols list:
Read in a CSV File Into a Pandas DataFrame
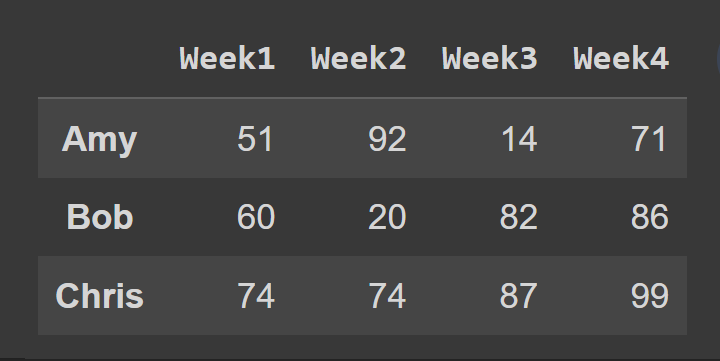
Suppose the student data is available a CSV file. You can use the read_csv() function to read in the data from the file into a pandas data frame. pd.read_csv(‘file-path’) is the general syntax, where file-path is the path to the CSV file. We can set the names parameter to the list of column names to use. Now that we know how to create a data frame, let’s learn how to select rows and columns.
Select Columns from a Pandas DataFrame
There are several built-in methods that you can use to select rows and columns from a data frame. This tutorial will go over the most common ways to select columns, rows, and both rows and columns from a data frame.
Selecting a Single Column
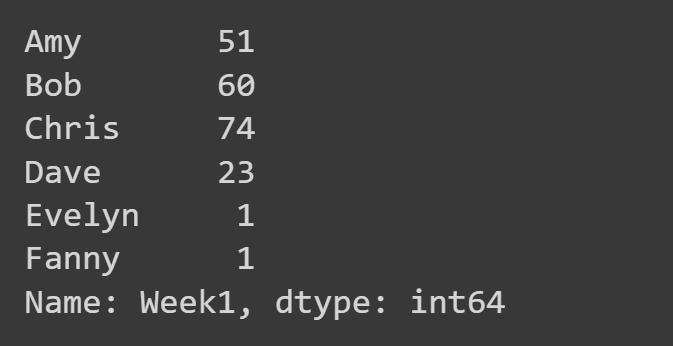
To select a single column, you can use df_name[col_name] where col_name is the string denoting the name of the column. Here, we select only the ‘Week1’ column.
Selecting Multiple Columns
To select multiple columns from the data frame, pass in the list of all the column names to select. In addition to this method, you can also use the iloc() and loc() methods to select columns. We’ll code an example later.
Select Rows from a Pandas DataFrame
Using the .iloc() Method
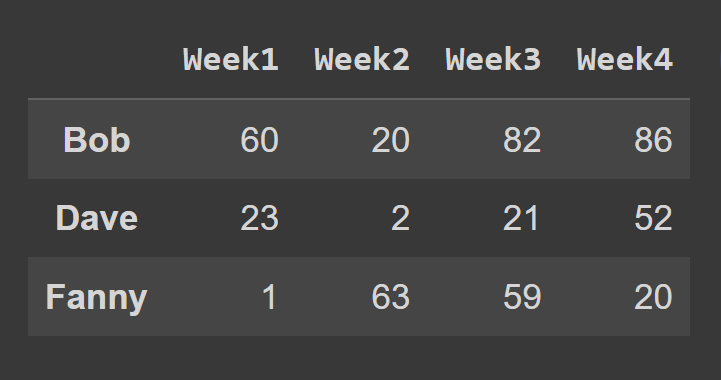
To select rows using the iloc() method, pass in the indices corresponding to all the rows as a list. In this example, we select the rows at odd index. Next, we select a subset of the data frame containing the rows at index 0 to 2, the end point 3 is excluded by default.
Using the .loc() Method
To select the rows of a data frame using the loc() method, you should specify the labels corresponding to the rows you’d like to select.
Select Rows and Columns from a Pandas DataFrame
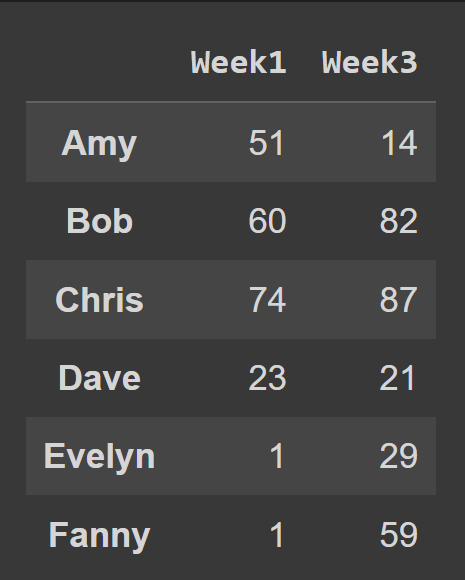
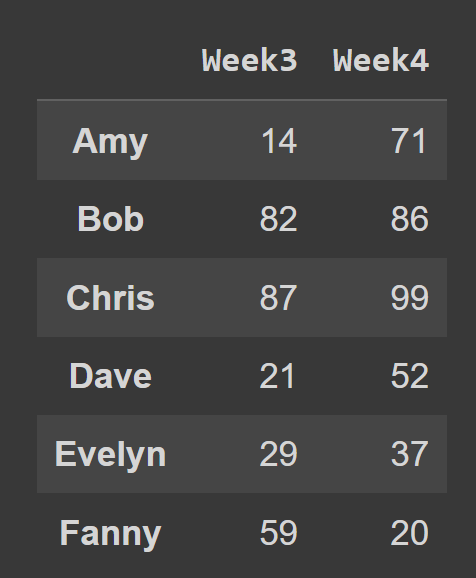
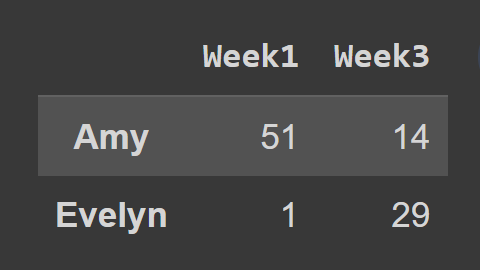
So far, you have learned how to select either rows or columns from a pandas data frame. However, you may sometimes need to select a subset of both rows and columns. So how do you do it? You can use the iloc() and loc() methods we’ve discussed. For example, in the code snippet below, we select all rows and columns at index 2 and 3. Using start:stop creates a slice from start up to but not including stop. So when you ignore both the start and stop values, when you ignore the start and the stop values, the slice starts at the beginning—and extends up to the end of the data frame—selecting all the rows. When using the loc() method, you have to pass in the labels of the rows and the columns you’d like to select, as shown: Here, the dataframe subset_df2 contains Amy and Evelyn’s record for Week1 and Week3.
Conclusion
Here is a quick review of what you have learned in this tutorial:
After installing pandas, you can import it under the alias pd. To create a pandas data frame object, you can use the pd.DataFrame(data) constructor, where data refers to the N-dimensional array or an iterable containing the data. You can specify the row and index, and column labels by setting the optional index and columns parameters, respectively. Using pd.read_csv(path-to-the-file) reads the contents of the file into a data frame. You can call the info() method on the data frame object to get information on the columns, the number of missing values, data types, and the size of the data frame. To select a single column, use df_name[col_name], and to select multiple columns, particular column, df_name[[col1,col2,…,coln]]. You can also select columns and rows using the loc() and iloc() methods. While the iloc() method takes in the index (or index slice) of the rows and columns to select, the loc() method takes in the row and column labels.
You can find the examples used in this tutorial in this Colab notebook. Next, check out this listicle of collaborative data science notebooks.